Difference between revisions of "Dashboard"
From Shopnix Help
(→Where can I access the bulk editing feature in store manager?) |
(→Where can I access the bulk editing feature in store manager?) |
||
| Line 46: | Line 46: | ||
[[Image:db9.png | 1200px | frameless]] | [[Image:db9.png | 1200px | frameless]] | ||
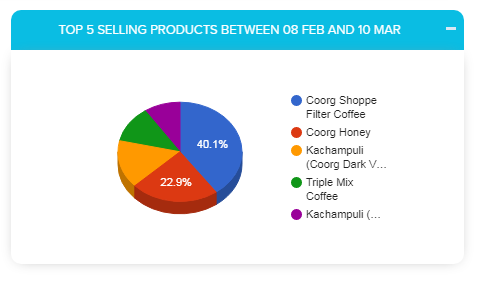
| − | Now comes to top 5 selling products in a month widgets.Here the information will show as pie chart. | + | Now comes to top 5 selling products in a month widgets.Here the information will show as pie chart.The data that will show inside pie chart is based on the |
| + | amount not on units.Example suppose if someone placed an order for nokia lumia having cost 6000.00 and some one placed an order of 100 units of mobile charger having cost 700.00 each(total=100 * 700.00=7000.00),then in the pie chart the nokia lumia's data will display rather than the mobile charger.Because 1 unit of nokia lumia,the cost is 6000.00.But for 1 unit of mobile charger,the cost is 700.00. | ||
[[Image:db11.png|frameless|1200px]] | [[Image:db11.png|frameless|1200px]] | ||
If you have more queries or would like assistance with this please contact us on [mailto:support@shopnix.in support@shopnix.in]. | If you have more queries or would like assistance with this please contact us on [mailto:support@shopnix.in support@shopnix.in]. | ||
Revision as of 14:55, 6 May 2014
What is Dashboard?
Dashboards often provide at-a-glance views of KPIs (key performance indicators) relevant to a particular objective or business process (e.g. sales, production etc)
Where can I access the bulk editing feature in store manager?
After login with your credentials the first page that you saw is the dashboard page.
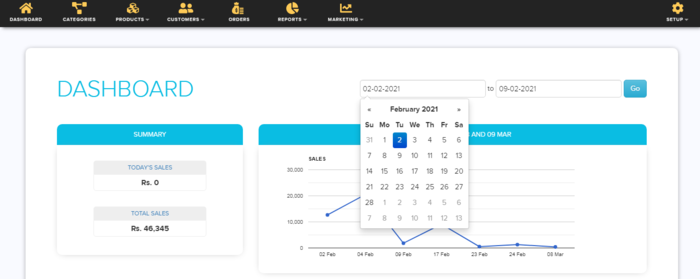
First start with date at the top right
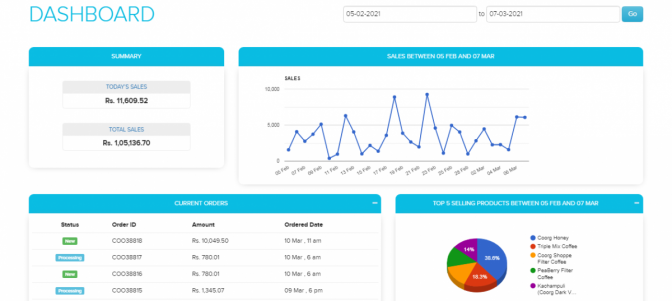
Initially the date would be for 1 month suppose if today is 5th MAY 2014 then it will show from 5th APRIL 2014 to 5th MAY 2014.However you can change the date according to your requirement,according to that data in the figures will change.We will discuss about that one by one.
Suppose I want to see the last 7 days so I can mention like below
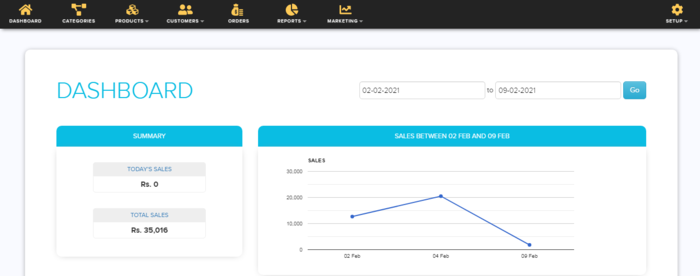
and click on the  button.It will display the information(from 29th Apr 2014 to 5th May 2014) in different figures as below
Now move to summary widget
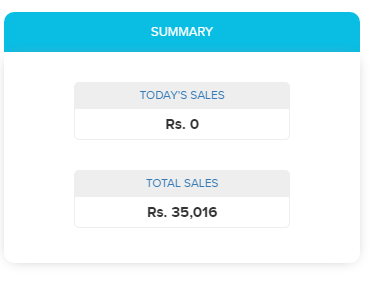
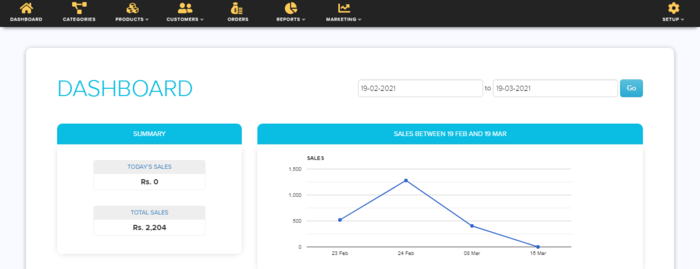
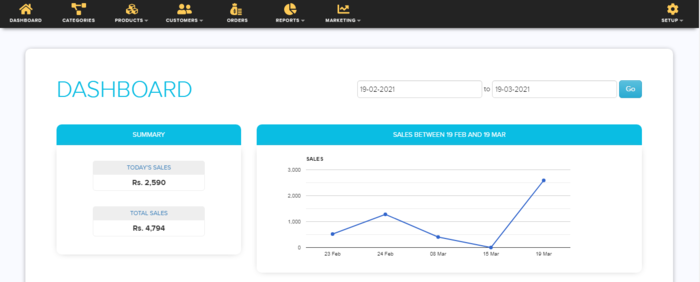
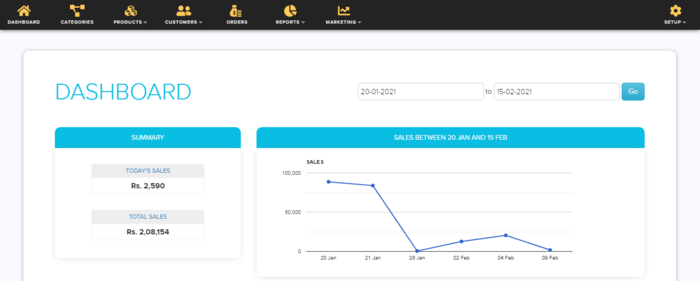
As you can see in the TODAY'S SALE section the value is the today's sale value and in the TOTAL SALES's section the value will be the total sales for a given duration(initially it is for 1 month,if you change the criteria in the date section then the value will be display according to that).
In the below figure as you can see the (summary section) the today's value is 0.00 as no one placed a single order,in the total sales the value is 27,942.60 (remember the value is for last 1 month example 6th Apr 2014 to 6th May 2014).
In the below suppose customer(s) placed an order for 6880.00 so TODAY'S SALE id 6880.00 and TOTAL SALE is 34822.60 i.e 27942.60(previously) + 6880.00.
Suppose you want to search for a given time duration like below the total sale will be for that particular time duration
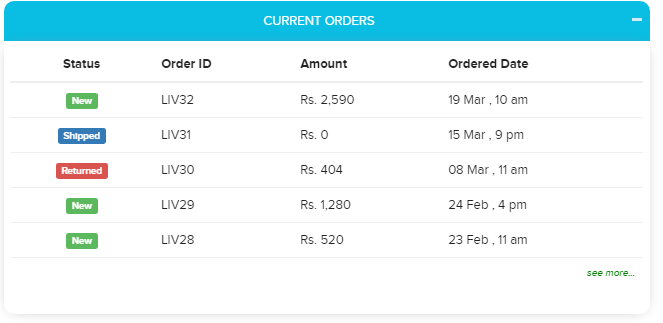
Now comes to current orders widget ,here you can view all the current orders.You can also minimize the widget by just clicking on ![]() option.
option.
Now comes to top 5 selling products in a month widgets.Here the information will show as pie chart.The data that will show inside pie chart is based on the amount not on units.Example suppose if someone placed an order for nokia lumia having cost 6000.00 and some one placed an order of 100 units of mobile charger having cost 700.00 each(total=100 * 700.00=7000.00),then in the pie chart the nokia lumia's data will display rather than the mobile charger.Because 1 unit of nokia lumia,the cost is 6000.00.But for 1 unit of mobile charger,the cost is 700.00.
If you have more queries or would like assistance with this please contact us on support@shopnix.in.

